JOURNAL / AI RESEARCH & EFFICIENCY

Measure the whole
cost of intelligence.

An AI system is more than a model call. Measure the resources, time, and human work required to deliver a result people can use.

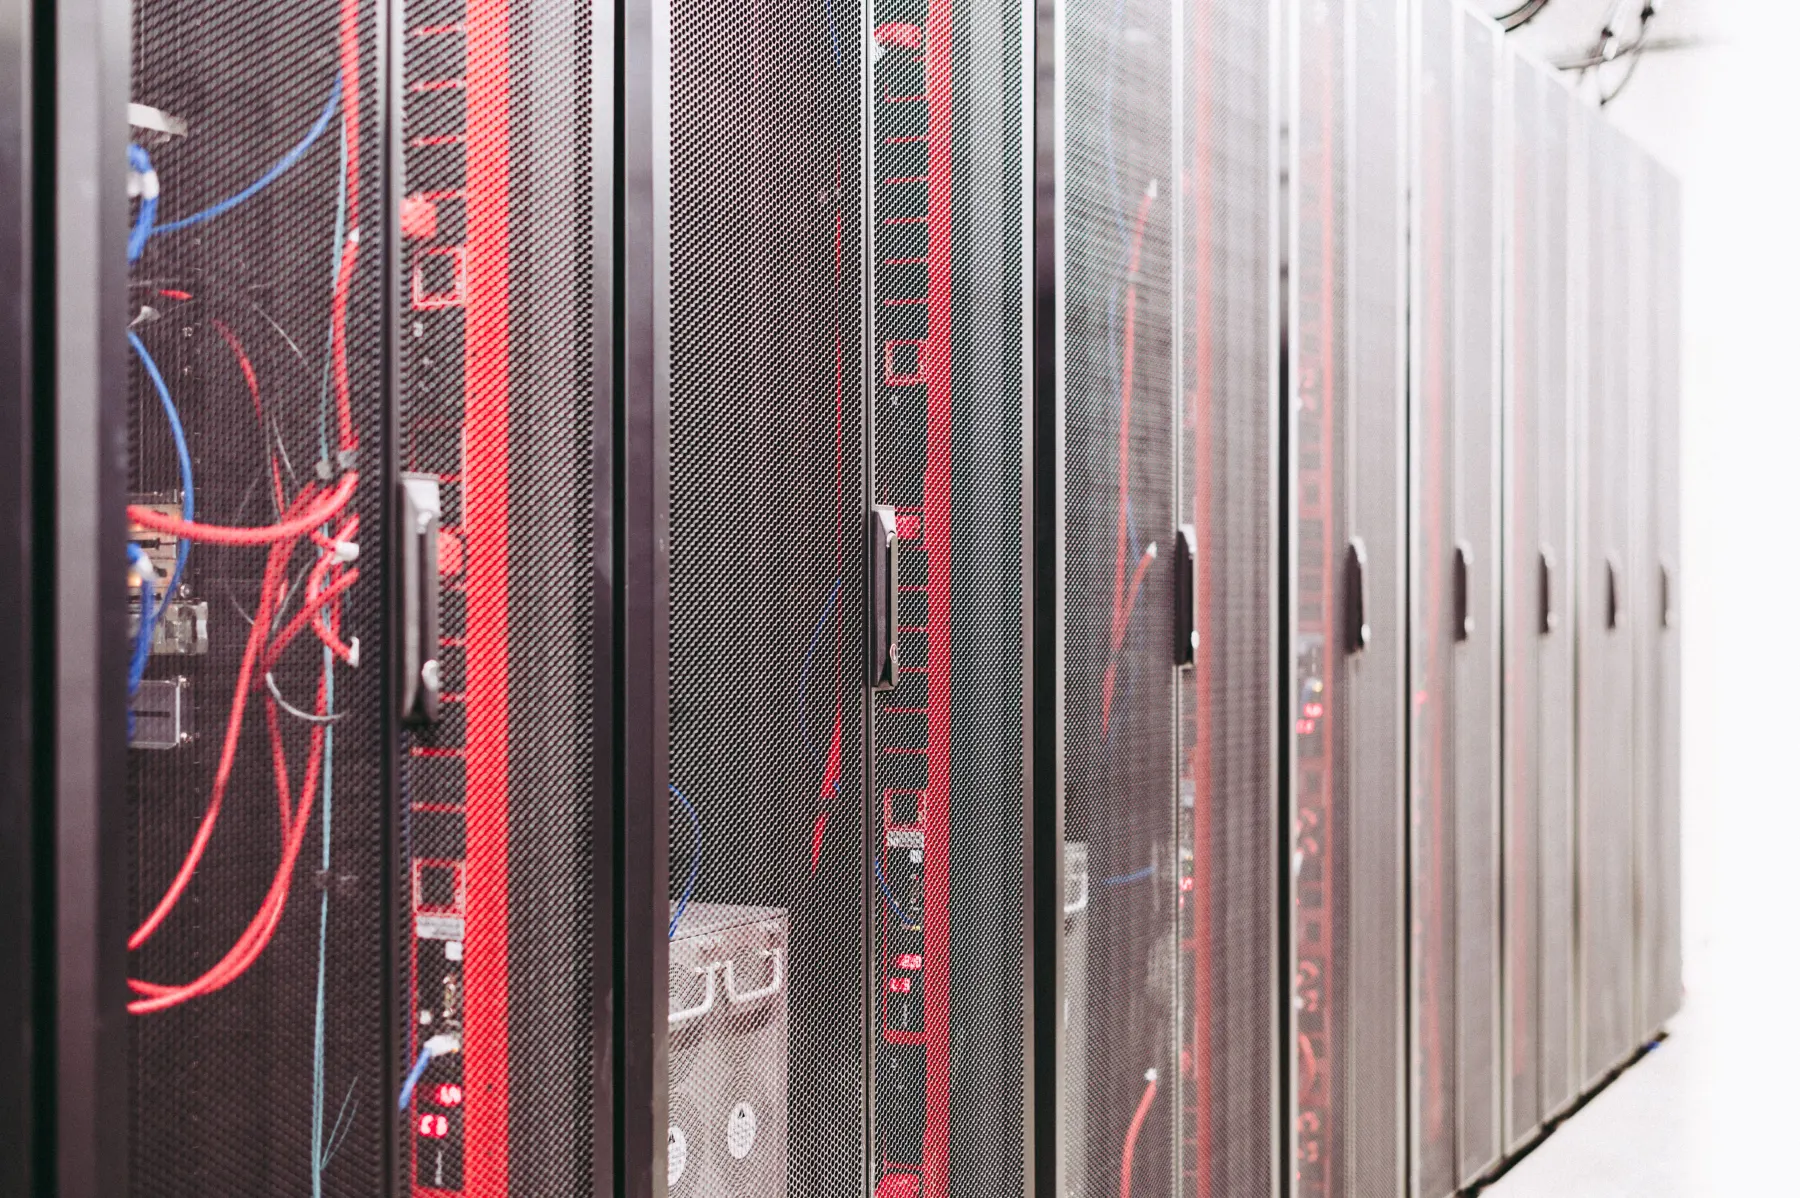
Rows of server racks connected by network cables
Every intelligent service runs on physical infrastructure, with costs that extend beyond the model call.
01 / NAME THE BOUNDARY

A model call is one line in the account.

“AI cost” can mean the provider bill for one request, the electricity used by a server during a test, the cost of running a service for a month, or the effort it takes a person to check the answer. Those are related questions, but they do not share one denominator. Start by saying what decision you are trying to make and where the measurement begins and ends.

Build the systemModel training or adaptation, data preparation, evaluation, and engineering. These costs are usually incurred before each user task.
Serve a requestInput and output, retrieval, tool calls, repeated attempts, and the compute used to process them.
Keep it availableCapacity, storage, monitoring, networking, and the energy of a service that may be waiting between requests.
Finish the workReview, correction, escalation, and any steps still needed before the result is accepted.

A useful report keeps one-off development separate from recurring service costs. If you spread development across future tasks, show the expected number of tasks and the time period behind that estimate. The assumption is part of the result.

Keep a provider invoice distinct from an energy measurement. A bill may depend on input and output tokens, cached context, model choice, and additional services. Record the tariff and billable units used for the comparison, then reconcile estimates with the actual bill; token pricing does not reveal how much energy a server used.

For a closer look at what happens inside a request—from prompt processing to generated output—read how inference and serving work ↗.

02 / MEASURE USEFUL OUTCOMES

Tokens are activity. A completed task is an outcome.

Price per token and energy per token can help explain a system. On their own, they do not say how much it costs to get work done. A longer answer can lower the average energy assigned to each token while still using more energy overall. A workflow can also call several models, retrieve documents, retry a failed step, or wait for a person to repair the result.

A 2026 study of H100 and H200 inference workloads illustrates the denominator problem. In one H200 setup—a 16-request batch with a 4K-token context—raising the output length from 10 to 512 tokens reduced reported energy per token from 7.46 to 0.72 joules, while energy for the batched inference window rose from 1.19 to 5.93 kilojoules. Those figures describe that model, hardware, batch, and context; they are not a universal prompt estimate. Read the measurement study ↗

For a product decision, compare the resources used to reach the same verified outcome.

Choose a success rule before measuring. For example, count a task as complete only when it passes the same quality check, includes required evidence, and needs no more than the agreed level of correction. Then report resources per accepted task alongside request-level figures. This keeps a fast but unreliable system from looking efficient simply because it produced an answer quickly.

QualityDid the result meet the task’s acceptance criteria?
EnergyHow much was used by one request, a batch, or an accepted task?
TimeHow long until the first useful response and the completed result?
CapacityHow much work can be served at the same quality and latency?

Keep the units visible. Kilowatt-hours, seconds, memory, provider charges, and reviewer minutes can sit in one comparison, but they should not be blended into an opaque “efficiency score.”

03 / READ ENERGY NUMBERS CAREFULLY

State what the meter can see.

Power, measured in watts, describes the rate of energy use at a point in time. Energy, measured in watt-hours or joules, accumulates over a defined interval. A power rating or a GPU utilization reading is not, by itself, the measured energy of a completed task.

The MLPerf Inference power results provide a useful example of a defined boundary: they report measured average AC power or energy for the entire system during the accompanying benchmark, with AC power measured at the wall. MLPerf also says those results apply to that benchmark; a hardware rating or an unvalidated power figure is not the same measurement. See MLPerf’s power measurement notes ↗

GPU telemetry can be useful for locating a bottleneck, but label it as GPU energy if that is all it covers. A whole-server reading may include the host and other components. Cooling, networking, storage, and the wider facility can sit outside even that boundary. Report what you measured, what you estimated, and what remains outside the number.

Energy use and climate impact are also different quantities. An emissions estimate needs an electricity emissions factor for a stated place and time, plus a method for applying it. For the larger grid, data-centre demand, and local infrastructure context, continue with AI energy and infrastructure ↗.

04 / BUILD A FAIR COMPARISON

Hold the task steady. Make the system visible.

A useful comparison is repeatable enough that someone else can understand what changed. Use the same representative tasks and success criteria, and record the complete configuration: model and version, hardware, software stack, context and output limits, batch or concurrency, and serving strategy.

  • Choose a workload that reflects the task, including typical and longer inputs.
  • Warm up the system, then measure repeated runs under the same load pattern.
  • Define the measurement window and whether it covers the GPU, full server, or another boundary.
  • Report quality, retries, latency, throughput, memory, and energy together.
  • Show the spread across runs, not only a best result; if subtracting idle power, show the raw reading and the subtraction method too.
  • List exclusions, such as retrieval, tool services, networking, cooling, or human review.

System choices matter as much as the model. A 2026 H100 study examined numerical precision, batching, and request scheduling and found that their energy effects varied with the workload and inference phase. It is evidence that serving design deserves measurement, not a promise that the same change will produce the same gain on every platform. Read the serving-efficiency study ↗

For a parallel guide to task setup, graders, and the limits of benchmark scores, see how to read AI benchmarks ↗.

05 / COUNT THE WORK AROUND THE MODEL

The final answer may still need a person.

Review and correction belong in the operational picture whenever the task depends on them. Track how often a person must check a result, how long that check takes, which errors trigger rework, and how frequently the work must be escalated. A system with a low API bill may still require substantial effort after the response arrives.

Also include the services around generation when they are part of the real workflow: document indexing, search, tool execution, safety checks, retries, and logging. If those are excluded from a model-only test, keep them visible in a separate service-level view. The purpose is to find the cost center, not to force every resource into one invented unit.

For systems that use retrieval or tools, trace each added step against the task it is meant to improve. Read how prompt caching changes repeated work ↗ and how tool calls add actions to a workflow ↗.

06 / TURN MEASUREMENT INTO DESIGN

Find the bottleneck before changing the model.

Measurements help identify which part of the system is consuming time or resources. Then change one thing at a time and rerun the same workload. Depending on the result, a useful experiment might be a smaller model, quantization, caching repeated context, batching, a simpler retrieval path, or fewer unnecessary retries.

Keep the quality threshold fixed while comparing. If a change saves energy but increases correction, latency, or failure rates, record the trade-off instead of declaring a win from one metric. A system is more efficient when it delivers the required work with fewer total resources—not when one counter gets smaller while the work moves somewhere else.

For deeper reading, explore model quantization ↗ and Symploka’s research on efficient intelligence ↗.

The strongest efficiency claim is specific: same task, same quality bar, stated boundary, measured resources.

PRIMARY SOURCESMLCommons, MLPerf Inference: Edge — power measurements ↗Vellaisamy et al. (2026), Characterization of Request and Token Energy Costs for LLM Inference Workloads on GPU Platforms ↗Delavande, Pierrard & Luccioni (2026), Understanding Efficiency: Quantization, Batching, and Serving Strategies in LLM Energy Use ↗

Follow AI’s energy use into the infrastructure ↗
Read benchmark results in context ↗
Understand the inference behind each request ↗